1. The Length of a certain species of fish has a normal distribution with mean 50 mm and standard deviation 4.5 mm. A random sample of four fish is drawn and their length X1, X2, X3, and X4, are observed. Calculate the probability that.
-
- (3 pts) All four fish have lengths between 51 and 60 mm
- (3 pts) The mean length of the four fish is between 51 and 60mm
- (3 pts) Explain why the answer to part A would always be bigger than answer to part b.
Answer:
a. P (51 < X < 60) = ( 51-50/4.5) < X < ( 60 – 50/4.5)
= 0.22 < X < 2.22
= 0.986791 – 0.587064 = 0.399727
b. Mean of Sampling Distribution = 50 mm
Standard Deviation of the Sample = 4.5/sqrt(4)
= 4.5/2 = 2.25
t (51) = 51 – 50/ (2.25) = 1 / 2.25 = 0.44
t (60) = 60 – 50/ (2.25) = 4.44
Df = 4 -1 =3
P (51 < t < 60) = 0.9894 – 0.6551
=0.3343
c. The answer to part A will always be bigger because it is taken from a larger population, whereas the part b is taken from sample, and due to less number of observations, the probability will be less.
2. (3pts) Using computer simulation, several independent random samples each of size n were drawn from a population that has a normal distribution with mean 50 and a standard deviation 9. This means of the samples were then calculated and it was found that 68%of the sample means lies between 48.5 and 51.5. Find the sample size n. Assume that n is large enough for the central limit theorem to hold.
Answer: 48.5 – 50 /( 9/sqrtN) < X < (51.5 -50)/ 9 sqrtN) = 0.68
= 1.5/(9/sqrtN)< X< 1.5/(SqrtN) = 0.68
= 1.5/(9/sqrtN) = 0.408
= (1.5* SqrtN) = .408
= SqrtN = 0.408/1.5
Sqrt N = 0.272
N = .073984
3. A random variable x has a binomial distribution with n – 100 and p=.45. Using the Normal approximately to the binomial with continuity correction, calculate the following probabilities
a. P(X=50)
b. P(x>60)
c. P(40<X<50)
a. 0.048151971
b. 0.000938232
c. 0.682367
4. Recall the population of Ellipticus (copy attached). Using stat crunch, drawindependent random samples of 5 non-mutants and 5 mutants from this population. Then measure the lengths (to the nearest millimeter) of Y1, Y2, Y3, Y4, and Y5 be the lengths of the mutants. Using the data
3 points each
A. Obtain a 95 confidence interval for the population mean length μNof non mutants
B. Obtain a 95 confidence interval for the population means length μM of mutants
C. Obtain a 95 confidence interval for the difference in population mean length μN-μMbetween non-mutants and mutants
5. The manufacturer of a new prostate cancer drug claims that it has a least 65% cure rate. You are the statistician assigned to validate the claim with data. So you administered the drug on a random sample of 30 patients and proceed with the following test:
Let p be the unknown cure rate and let the random variable x be the number of cures among the 30 patients.note that x has a binomial distribution with n-30 and event probablity p.
Set up the null hypotheses ho: p0.65
Decision rule: reject ho if the observed number of cures x>25
3 point each
A. Using statcrunch calculate y(p) for p= .1,.2,.3,.4,.5,.6,.7,.8,.9
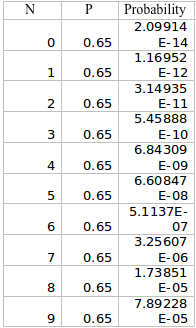
B. Graph y(p) versus p using excel (line graph)
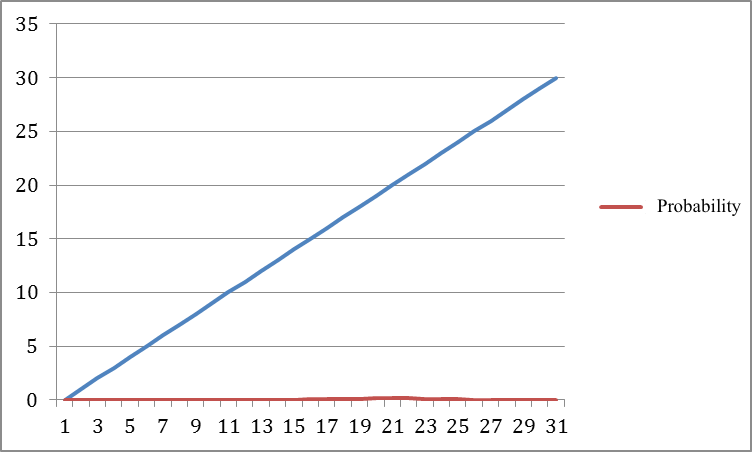
C. Dicuss briefly how good you this test is based on they(p) above.
Answer:
The the line is straight sloped line, it shows the there is a constant increase in success with increase in the p or sample
D. Construct a test x> a for the null hypothesis ho: p=0.65 that will allow you to 10% chance of making a type 1 error (i.e. rejecting a true h0) with maximum probability of rejecting ho y (0.8) when in fact the true state of nature is ha: p=0.8
Test will be based on the changes, with the rejection region of 10% and same the chance of making type I error. The test will consist the sample, with the probability of success change to 0.85